

Following the global outbreak of the coronavirus in 2020, the White House, NIH and several research groups started a Kaggle competition to use AI solutions to mine data an extract valuable information from the rapidly increasing body of research. The resources included over 100,000 full texts, including information about COVID-19 as well as other related coronaviruses. We set out to tackle the challenge by first using a combination of unsupervised clustering methods for exploring similar text and second, comparing classification results between traditional methods and one of the state-of-the-art attention models BioBERT, a variant of Google’s BERT.
Our group consisted of several researchers with PhDs in cognitive psychology as well as a Data Engineer, ML Engineer, and Data Scientist. Several questions were provided surrounding COVID-19 and 17 specific tasks were outlined. Based on our research background, we selected “What has been published about ethical and social science considerations?” This consisted of seven separate tasks shown below:
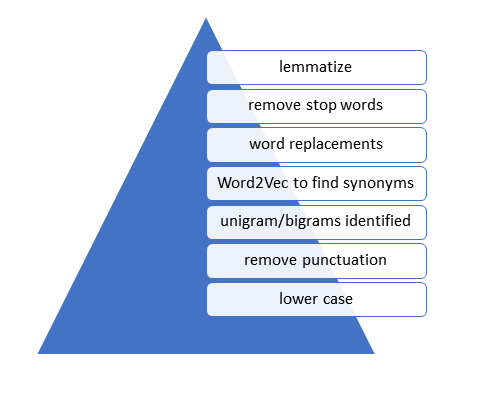
Our initial steps including data cleaning consisting of evaluating the difficulties and patterns within the text itself. While one-size-fit all methods are often used for text cleaning, a thorough vetting of the methods is conducted during data prep – ensuring the text is handled properly to extract critical information. For instance, looking at the most common unigrams (single word) and bigrams can help us identify important topics as well synonyms that can be grouped together.
We also conducted stemming and lemmatization – two different methods to try to reduce variations in words to a common ‘stem’. The full cleaning process followed the process shown in the figure below.
We used a method called Word2Vec which creates word embeddings (a representation of words in a ‘vector space’ used to relate words to one other) and returns a proximity score for each word. For instance, using the term ‘Cornovirus’ returns several other related viruses. Using Word2Vec can provide insights into the text – including identifying synonyms that can be combined to simplify the text.
In the following figure we a technique called TSNE (a dimensionality technique) was used to simplify the dimensionality of words into two dimensions with similar words being closer in proximity to each other. This was used during exploration to find potential synonymous terms which could be replaced during the word replacement step (assist with clustering, reduce diversity of words).
From the cluster we see terms like ‘virus’, ‘avian’, ‘pathogen’ close in proximity. We also see ‘alphavirus’, ‘rvfv’, and ‘flavivirus’ being grouped together, viruses that do share some similarities. We now have the choice of creating an ontology and mapping specific terms to a parent term.
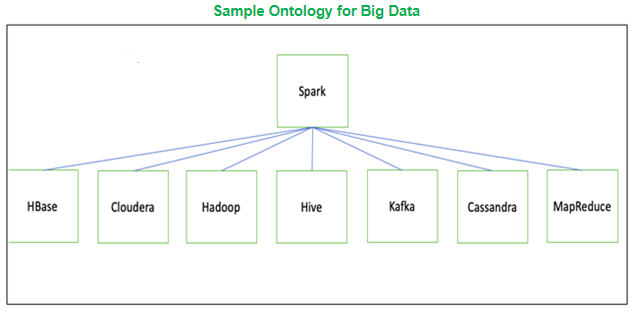
As an example, if we were mapping skill sets, we would create an ontology to connect synonyms. Then we would map the synonyms to a parent skill. This could either be a key that encompasses the synonyms such as ‘Big-Data-Processing’ or we can replace all synonyms to a specific skill such as ‘Spark’ as shown below. For our purposes, we kept mappings simple, combining spelling variants such as covid19 and covid-19 and ensuring proper stemming for popular words such as genome to gene.

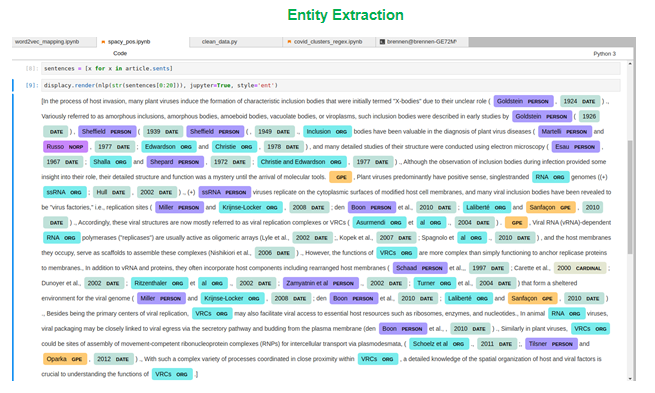
When exploring the text to identify important information, entity extraction was used to identify the type of entities such as people or organizations that were being referred to in the text. In the figure below we can see words being mapped to ‘PERSON’ entities as well as ‘DATE’, ‘ORG’ for organizations, and ‘GPE’ for geo-political entities. We used SpaCy for text extraction and these initial results and although the assignments are completely correct, entity extraction can be particularly useful for text exploration.
After extracting named entities, we can start seeing themes and common entities cited throughout the research. While we used this step to identify some important organizations, because we kept mapping simple, we didn’t end up grouping entities or encode additional features into our text. Instead, we ended our exploration of entities and modeling. However, if we had seen issues with clustering or modeling or seen some of these entities as common terms in our clusters – we could come back to this stage to try to simplify or otherwise transform the text as needed.
Cluster_0 = [patient, study, influenza, hospital, infection, participant, pandemic, care, sars, health]
Cluster_1 = [disease, infection, virus, animal, study, human, case, use, risk, pathogen]
In the first cluster above we can see articles tend to address the coronavirus in terms of medical services including words like infection, patient, health. While in the second topic the focus of these articles may be more geared to the nature of the disease itself. As we break the articles into more and more clusters, the differences between articles can become less discernible. Since the k-means algorithm doesn’t determine the number of clusters, it’s left to us to evaluate the clusters and determine the optimal number of clusters for the k-means algorithm to use. While there’s no perfect method, we used two popular methods to examine our clusters including TSNE and Silhouette scores.
After converting to the TF-IDF matrix, t-distributed Stochastic Neighbor Embedding (TSNE) can be used for dimensionality reduction and to embed multiple dimensions into a two-dimensional space. We won’t review the algorithm in more detail here, but in short, TSNE is a simplification of the dimensionality of the data and provides an intuitive sense for the nature of the data. It can also provide us a sense for the separability between the clusters.
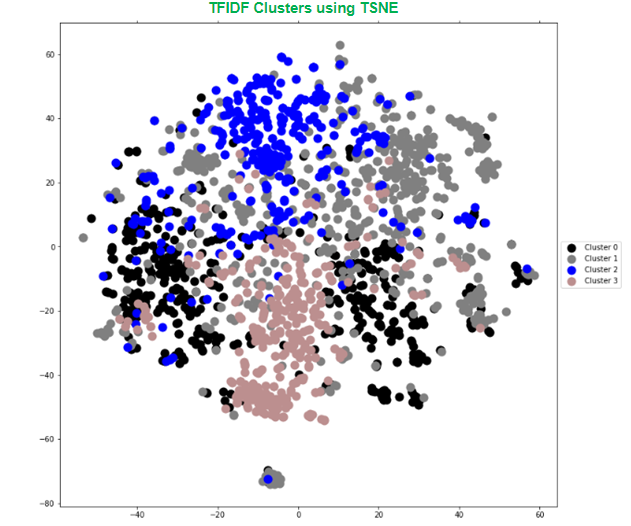
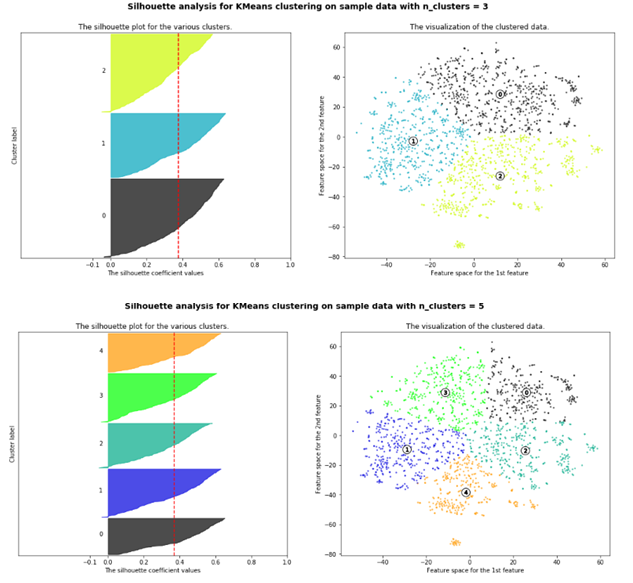
In the above example, there’s a lot of overlap between clusters suggesting a lack of clear distinction between topics. Even with some iterative data cleaning steps, we continued to see similar results for k-means plotting 3 up to 10 clusters.
Besides using T-SNE, we used Silhouette scores which is another popular method for evaluating the quality of the k-means clusters. When the the cluster’s silhouette scores are close to 1, clusters are distinct and easily separable, while values close to 0 suggests data points are close to the decision boundaries and may be easily confused.
After running through several variants of using K-means, we moved on to another technique called Latent Dirichlet Allocation (LDA) which worked much better for separating out relevant topics. LDA relates words to specific topics and identifies where latent topics are being used throughout each article to map documents accordingly. We used LDA to return ten separate topics found in the documents. Two of these topics were particularly relevant to our topic about social and ethical considerations in regard to Covid-19. Below are the most common words associated with these two topics.
topic_1 = "study health use research information review participant knowledge article report analysis response datum factor score disaster result public question measure emergency high identify risk search relate group medium perceive base"
topic_2 = "health public disease country research response national global policy surveillance develop development provide resource new international laboratory level information support control program capacity approach make community government process work service"
We used pyLDAvis package which creates an interactive panel where you can see the most relevant terms by Topic. The panel also allows us to adjust the relevancy of the terms; identifying different levels of frequency in text within a single cluster compared to its frequency across all clusters. We can see that some of our clusters likely include ethical and social science considerations.
We selected only those topics that demonstrated similarity to our topic of interest. We then iterated back over only these topics and went through the same unsupervised clustering methods. We went through this iterative process a couple times, selecting the relevant topics, reconducting clustering and re-selecting the most relevant topics. In the end, our unsupervised methods did a great job of identifying common terms and subjects within our topic of interest as we set out to do at the start of the project. Furthermore, it worked better than expected, at identifying articles primarily focused on our topics of interest.
Our next objective was text classification. The first objective was to hand label excerpts for training. After labeling, we then started training a more traditional model using TF-IDF. Terms are replaced with TF-IDF values which become the features the model uses to classify text. As simple as TF-IDF is, its quite powerful in practice and in many applications is more than sufficient. Finally, we trained a model using BioBERT embeddings like the word2vec embeddings we saw previously. BioBERT is a pretrained network, using millions of documents to train the model to understand how terms relate to each other in a large feature space. Given the nature of our data, we decided to use BioBERT in favor of BERT to resemble the nature of the documents being classified.
Input = TF-IDF matrix
Multinomial output (0-8)
Subtask 1 vs Not Subtask 1 Subtask 2 vs NOT Subtask 2 Etc.
We used BioBERT which is pretrained model. Using a pretrained model is often called transfer learning, as it allows us to use a previously trained model on our corpus. BERT (Bidirectional Encoder Representations from Transformer) has several important feature, one of the which is the transformer.
BioBERT has the same BERT transformer architecture, but embeddings created from 1,000,000+ PubMed science articles (Lee et al, 2019) so as to be more tuned to medical research articles.
The BERT algorithm makes use of the transformer feature to develop contextual relationships between surounding words and encodes each word usage with a distinct embedding. For our purposes, we average the embeddings across all words in each sentence.
We then tried two different models using the BioBert imbeddings including Random Forest and an Artificial Neural Network (ANN). The models were given the sentence imbeddings as input and the labelled excerpts (i.e. each text excerpt is fed into the model with a target subtask assigned). Below are a few subtask predictions from the ANN model.
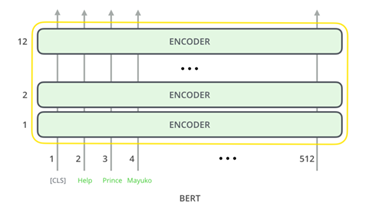
Transformer is an encoder-decoder architecture model with positional encodings to represent word position. It uses an attention mechanism which helps the model select the context that best fits the current input.
BERT is a 12-layer transformer model and uses these layers to help the model identify the key content found in the text. Multiple encoder layers provides increased capcity to encode contextual features from the text. The identified features can then be used by the rest of the model to more adequately create imbeddings based on term usage.
Subtask_ethical_education = ["A recent WHO review points to the need to engage with affected communities to establish the conditions and protections under which it is acceptable for surveillance to take place and develop institutional mechanisms that ensure ethical issues are systematically addressed before data collection, use and dissemination."]
Subtask_Psychological_Effects = ["Too much fear breeds hysteria. whose consequences might be worse than the threat that triggered fear in the first place. Too little fear, or rather too little cautious preparation, however, can lead to complacency, which is threatening in itself. Here it is worth noting that merely because there are medicines to treat infections, notably in industrialized countries, does not mean that infection and transmission are not threatening."]
Subtask_Ethical_Principals = ["This ruling interpreted the use of the public health authority and the way the court balanced two strong competing values: the public good and individual liberties (37). Gostin (35) argues that the resulting ethical conflict is more acute in the period preceding the emergency. However, early legislation enables legal definition of individual rights. thereby facilitating optimal actions during the emergency itself"]
Input = Biobert sentence embeddings
Final transformer layer = (768,)
Mean of embeddings across all tokens in each sentence
Output = Subtask vs not classifications (0-8)
We showed how unsupervised methods helped to understand the different topics in the text and find important terms and concepts we needed to capture. LDA worked particularly well to find revelant articles and were able to break larger topics into smaller target subtopics. Finally, we showed the difference in the performance of traditional methods, particularly TF-IDF to BioBERT.
When using TF-IDF, excerpts were based on possibly relevant terms such as psychology, health, public etc. However, since TF-IDF doesn’t capture context, we ended up with lots of false positives where the actual text had nothing to do with actual subtasks. BioBert, on the other hand, captured context dependent info allowing us to find much more relevant text and better separate out tasks. While there are many ways to go further and get better results (such as fine-tuning the model or adding more labelled samples) – our project demonstrated some of the limitations of TF-IDF and how BioBert can be used for context-dependent classification.
1 Kaggle. (n.d.). COVID-19 Open Research Dataset Challenge (CORD-19) An AI challenge with AI2, CZI, MSR, Georgetown, NIH & The White House. Retrieved October 15, 2020 from https://www.kaggle.com/allen-institute-for-ai/CORD-19-research-challenge/tasks?taskId=563.
2 Scikit-Learn. (n.d.). Selecting the number of clusters with silhouette analysis on KMeans clustering. Retrieved January 16, 2020 from https://scikit-learn.org/stable/auto_examples/cluster/plot_kmeans_silhouette_analysis.html

Our purpose is to assist individuals and organizations in making a positive difference in their industry and in their community through education, data strategy, and innovation.
Our mission is to create industry-leading, tailored solutions powered by sound research to assist companies in making data driven decisions and innovating in their field, engaging brilliant people, and cultivating diverse and forward-thinking perspectives.
Chicago, IL
Miami, FL
Kansas City, MO
Salt Lake City, Utah
San Francisco, CA
New York, NY
info@northwesternanalytics.com
