In the work Competing on Analytics (2017), Thomas Davenport and Jeanne Harris (2017) created the Five Stages of Analytical Competition which examines where an organization is between being “Analytically Impaired (Stage 1) to being a “Analytical Competitor” (Stage 5). Analytically impaired organization does not have substantial executive interest and does not have data analysts or a data program (Davenport & Harris, 2017). A stage 2 organization may have “Localized Analytics” being used in specific departments, but there is no specific strategy or widespread implementation. These organizations recognize a positive ROI using individual applications, but the effort is restricted to a few functional activities (Davenport & Harris, 62). Organizations with Analytical Aspirations are in the process of implementing strategy which is based on analytics and use data to improve a capability rather than a function. Stage 4 Analytical Companies use analytics for differentiation from their competitors, and analytics is seen as an organizational driver (Davenport & Harris, 62). Finally Analytical Competitors use analytics as a core part of their strategy and analytics themselves are “the primary driver of performance and value” (Davenport & Harris 62).
The DELTA Model examines the analytical capacity of an organization across 5 dimensions and is a tool which helps organizations develop a digital transformation roadmap by comparing their current state to their future state across 5 dimensions: Data, Enterprise, Leadership, Targets, and Analysts (Davenport & Harris, 46). The following matrix (reproduced from Davenport’s text) shows the 5 Stages of Analytical Competition on the x axis and the DELTA framework on the y axis. I have highlighted in yellow the stage at which the organization is at in each of these areas and included Davenport & Harris’ description of organizations at the specific stage. ‘Data’ represents the use of data by an organization as a “Strategic asset” (Davenport & Harris, pp 178). ‘Enterprise’ represents the organizations ability to integrate their analytical capabilities throughout the federated organization. ‘Leadership’ evaluates the types of leaders and their orientation to analytics, and ‘Targets’ represent the target objectives of the organization’s analytics program. Finally, ‘Analysts’ looks at the role that analysts play within the organization.
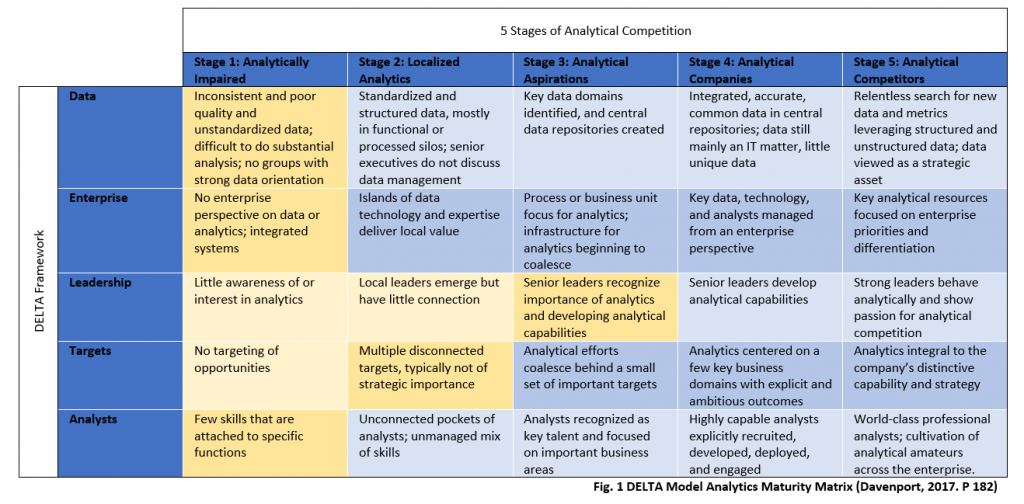
Thomas Davenport’s Five Stages of Analytical Competition
Beginning with Data some teams are handwriting data from some systems to import into others. There is no centralized repository, although some individuals do use an access database; the process however is entirely manual and changes from person to situation. There is also little to no use of integrated systems (which is the first solution we are providing them by creating automation scripts). Generally speaking, the culture of the organization has not embraced data or the value which it brings. For these reasons I have ranked the organization as a Stage 1 in both ‘Data’ as well as “Enterprise.’
Conversely, the executive leadership team believes very strongly in the importance and use of data, and even manually create dashboards for their team using Microsoft Word to visually share their insights. The executive leadership team also has begun to link strategy to data, and has provided me with their 3 and 5 year strategic plan which I will use to build the transformation roadmap. One major roadblock however is they do not have any on premise analysts to work with their data; although their executive leadership has ambitious goals, a chain is only as strong as its weakest link, and as a whole the organization is at a Stage 1.
Erickson’s Analytics IQ is a four-dimensional matrix which examines an organization’s maturity in terms of capability (Analytical Maturity), data preparation and storage (Data Maturity), Analytical Culture, and integration throughout the organization (Scale and Scope). Each dimension is divided into four stages which range from the most basic to the most complex. I have replicated Erickson’s table (Fig 2) and plotted where the organization scored on each of the four areas which I have included in an Analytics IQ Scorecard (Figure 3). In total I have found the organization to score on average a 17.5%. falling squarely in the third quadrant (the lowest scoring Quadrant) and “Flying Blind”. When it comes to Data Maturity I gave the organization 20 points; Although they use spreadsheets and have Access, some of their processes are still manually driven, sometimes even based on handwritten tallies.
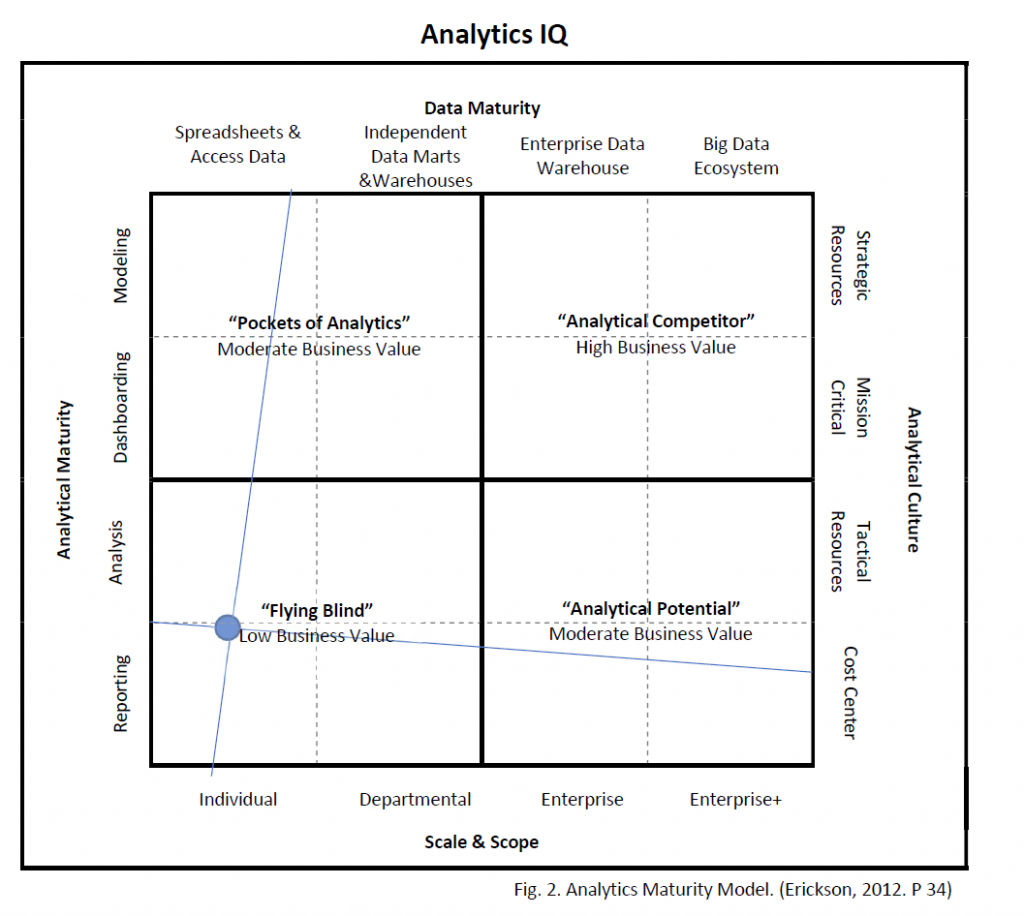
Ericksons Analytics IQ Matrix showing how mature the organization is related to their use of data.
Our Team’s presence was eye-opening for the organization. Our stakeholder interviews caused many of the managers to take a step back and evaluate their processes, and many of the processes were found to be unnecessary or in need of total reconsideration.
The concept of “data” itself is not easy for everyone to understand and can be frightening. Further, an organization which is not rooted in analytics and understands its value can see the work involved in a digital transformation as cumbersome, especially when “the old [handwritten] way works just fine.” Although the executive team feels strongly about the importance of analytics, analytics must be part of the organization’s culture.
While individuals are using applications and analytical tools such as excel, it varies by department. Further their use of the tools was restricted to reporting, however our team created PowerBI dashboards, linking their different data sources, and introducing basic modeling to allow them to predict the efficacy of their programs and their patient/client success.
Project:
Phase 1 Digital Transformation, PowerBI Implementation
Client:
Medium Nonprofit, Chicago, IL
Sponsor:
Business Analytics Practice
Year:
2020
Engagement Manager
Antonius Tran, Partner
Project Manager:
Andrew D’Amico, Partner
Team:
Saul Alarcon, Associate
Zahid Khalil, Associate
Erik Meija, Consultant
![]()
Our purpose is to assist individuals and organizations in making a positive difference in their industry and in their community through education, data strategy, and innovation.
Our mission is to create industry-leading, tailored solutions powered by sound research to assist companies in making data driven decisions and innovating in their field, engaging brilliant people, and cultivating diverse and forward-thinking perspectives.
Chicago, IL
Miami, FL
Kansas City, MO
Salt Lake City, Utah
San Francisco, CA
New York, NY
info@northwesternanalytics.com