
Modeling Economic Activity using GIS Light Emission Data.
We live in a global economy. Changes in local and regional areas not only impact demand for products and services, but influence all levels of the supply chain. Businesses must not only adapt to local and regional activity to maintain competitive advantage, but also incorporate this activity into their risk models. A business’s edge is finding access to data about local economic activity which is not only timely, but difficult to be manipulated, either by their competitors or by a third party such as a foreign government. Geographic Information Systems (GIS) light emission data is not only a strong economic predictor but represents physical data in the form of electromagnetic radiation, or light, which is not only difficult to conceal but expensive to manipulate.
This kind of data can provide businesses and other organizations unique economic data, especially during a pandemic such as Covid-19 when data might be limited or manipulated (Hudecheck, M. et al. 2020). Using this data we can build models to give sight to economic activity, changes in the logistic and supply chains, and monitor economic recovery at the local, regional, and national level.
Advantage of GIS data in Predictive Modeling
Although financial transactional data such as credit card usage gives us a view of economic activity the data is not only private but incomplete, only providing us insight into electronic transactions. Traditional economic indicators such as GDP are lag indicators which are not suitable for real time modeling and can also be prone to manipulation (Zhang, X. 2020). As participants in a global economy it is imperative that businesses and organizations not only have access to accurate and timely data, but data at local, regional, and national scale. The use of GIS satellite data, such as light emissions, provides analysts insight into the activity levels of local and regional economies which otherwise might not be directly available.
According to MIT Sloan, there is a high correlation between economic activity and the reduction of light emission from transportation nodes in city centers. According to the IMF, light emissions can account for 44% of the variation found in GDP (Hu, Y. & Yao, J. 2019.) and can accurately predict local economic activity, electricity usage, local levels of income, as well as monitor conflicts and natural disasters (Donaldson, D., & Storeygard, A. 2016.). Images such as those from the Visible Infrared Imaging Radiometer Suite (VIIRS) can be used to detect changes in nighttime light emissions (Hudecheck, M. et al. 2020).
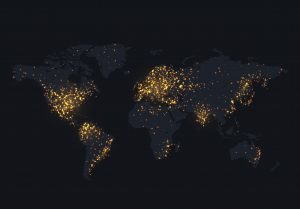
Light emissions from different geographic regions can not only be measured, but by applying time series analysis and machine learning techniques can provide insight about economic activity and production.
Changes in light emissions from highways, seaports, and freight yards could indicate a change in volume and velocity of shipments. This can also be used to detect changes in traffic patterns and logistic networks. Sensing data can provide early detection of trouble points, real time threat detection and evaluation of a local economy’s reaction time, and an overall change in regional activity and recovery (Hudecheck, M. et al. 2020). It further reduces reliance on government data, which is slow and able to be manipulated (Zhang, X. 2020).
GIS data is extremely beneficial for business and other organizations since it provides physical data which would otherwise be impossible or unrealistic for the analysts to obtain. GIS data is one example of “Big Data” given that the sheer amount of the data is only limited by the resolution of the satellite and the number of bands captured.
One great benefit is the limitless utility of scientific data: the data itself is not necessarily structured to only provide insight to a limited “problem” but is meant rather to be representative of a phenomenon as a whole; as such it can provide insight into multiple unrelated queries far outside of the researcher’s initial scope. GIS light emission data can help businesses and other organizations build accurate models of economic activity even in areas where it would be impossible or even dangerous to mine data in real time, although the use of GIS satellite images presents both ethical as well as political risk. While a few public satellites exist, access to satellite data can be extremely costly and requires data scientists who are experts in understanding GIS data.
Advantages of GIS Data
- Changes in local and regional areas not only impact demand for products and services, but influence all levels of the supply chain.
- Businesses must not only adapt to local and regional activity to maintain competitive advantage, but also incorporate this activity into their risk models.
- A business’s edge is finding access to data about local economic activity which is not only timely, but difficult to be manipulated, either by their competitors or by a third party such as a foreign government.
- GIS light emission data is not only a strong economic predictor but represents physical data in the form of electromagnetic radiation, or light, which is not only difficult to conceal but expensive to manipulate.
- Using this data we can build models to give sight to economic activity, changes in the logistic and supply chains, and monitor economic recovery at the local, regional, and national level.

Andrew is a General Partner at Northwestern Analytics and is the managing partner responsible for Business Operations and Project Management. Andrew holds his Project Management Professional certification and also serves as the Chief of Staff of Business Outreach for the Project Management Institute Chicagoland Chapter.
-
Andrew Damicohttps://www.northwesternanalytics.com/author/andrew-damico/

-
Andrew Damicohttps://www.northwesternanalytics.com/author/andrew-damico/

-
Andrew Damicohttps://www.northwesternanalytics.com/author/andrew-damico/
-
Andrew Damicohttps://www.northwesternanalytics.com/author/andrew-damico/


Hi there, just became aware of your blog through Google,
and found that it’s truly informative.
I’m going to watch out for brussels. I’ll
be grateful if you continue this in future.
Numerous people will be benefited from your writing.
Cheers!